Why Event-Driven Architecture With a Centralized Dead-Letter Queue Makes Distributed Systems Easily Debuggable
Distributed systems earn their bad reputation for debugging mostly because of how they’re designed, not because distribution is inherently opaque. When services call each other synchronously through long chains of HTTP requests, a single failure anywhere produces symptoms everywhere — and tracing the origin means reconstructing a timeline across logs scattered across a dozen services, each with its own format and clock drift. There’s a better structural answer to this, and it’s one that’s become a default for me on backend systems: a Microservices-based Event-Driven Architecture where services are fully decoupled through a central message broker.
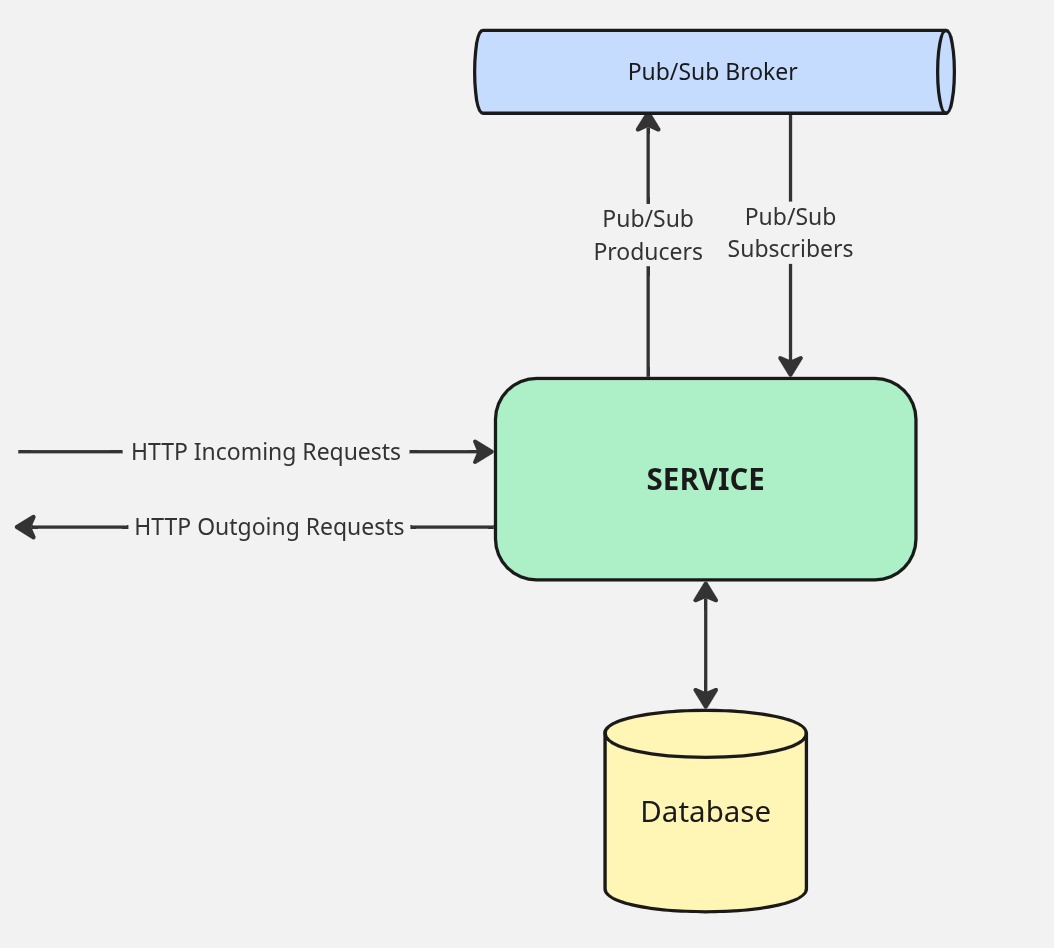
The unit of this architecture is the service itself. Each microservice owns a single domain, talks to its own dedicated database, and is the only thing allowed to write to that data. Externally, it has two communication modes: it publishes and subscribes to events through a Pub/Sub broker — Google Pub/Sub, Apache Kafka, and RabbitMQ are the usual suspects — for anything that can tolerate asynchrony, and exposes REST endpoints for the narrow set of queries that need a synchronous, low-latency answer. There’s also a third pattern worth calling out: a service can accept a command over HTTP and, rather than processing it inline, immediately publish the payload to a topic it subscribes to itself. The HTTP call returns quickly, and the actual work happens asynchronously through the normal event pipeline. This keeps the API surface thin and responsive while letting the processing logic live entirely within the event-driven flow.
This decoupling is what makes the system actually debuggable. When something goes wrong in a synchronous HTTP chain, the failure is often masked or transformed by the time it surfaces. In an event-driven system, the failure is contained at the subscriber that couldn’t process the message. When a subscriber throws an exception, instead of silently dropping the message or retrying indefinitely, it publishes to a central DLQ topic with two things attached: the original payload and the full stack trace. Both matter. That’s the key insight behind the Centralized Dead Letter Queue. The payload tells you exactly what the service was trying to process; the stack trace tells you exactly where and why it failed. There’s no ambiguity, no reproducing a request from memory.
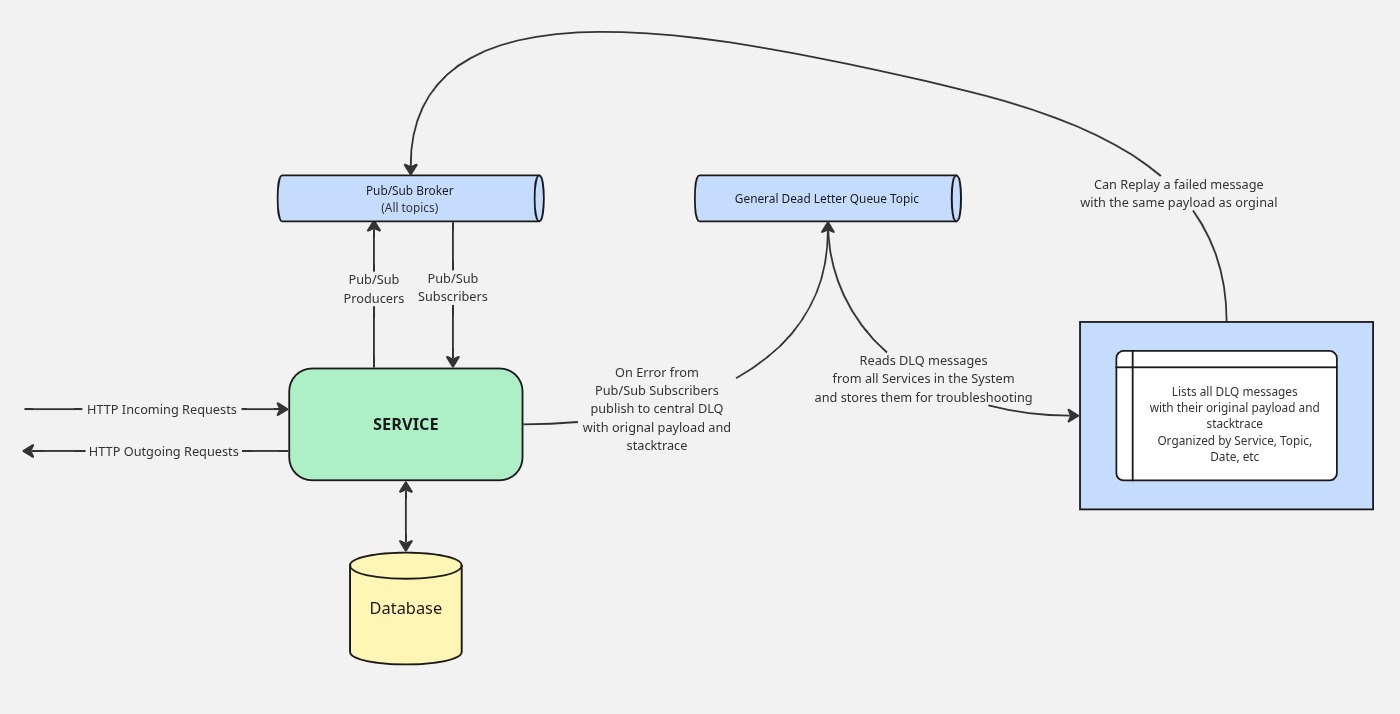
From there the workflow is straightforward. A dedicated consumer service reads from the general DLQ topic, stores the messages in a file bucket or database, and surfaces them in a UI organized by producer service, topic, error message and date. An engineer investigating a failure opens the DLQ UI, finds the failing messages for the services he owns, reads the stack trace, and has everything needed to diagnose the problem — often without touching a log aggregator at all. Once a fix is deployed, they can replay the original message with its exact payload directly from the UI, confirming the fix and recovering any affected state in one step. If the message is simply invalid and not worth reprocessing, they delete it. The whole loop — detection, diagnosis, fix, recovery — is something a single engineer can close without a war room or a support ticket chain. That’s not just a better developer experience. It’s a structural property of the architecture.